Figure 3
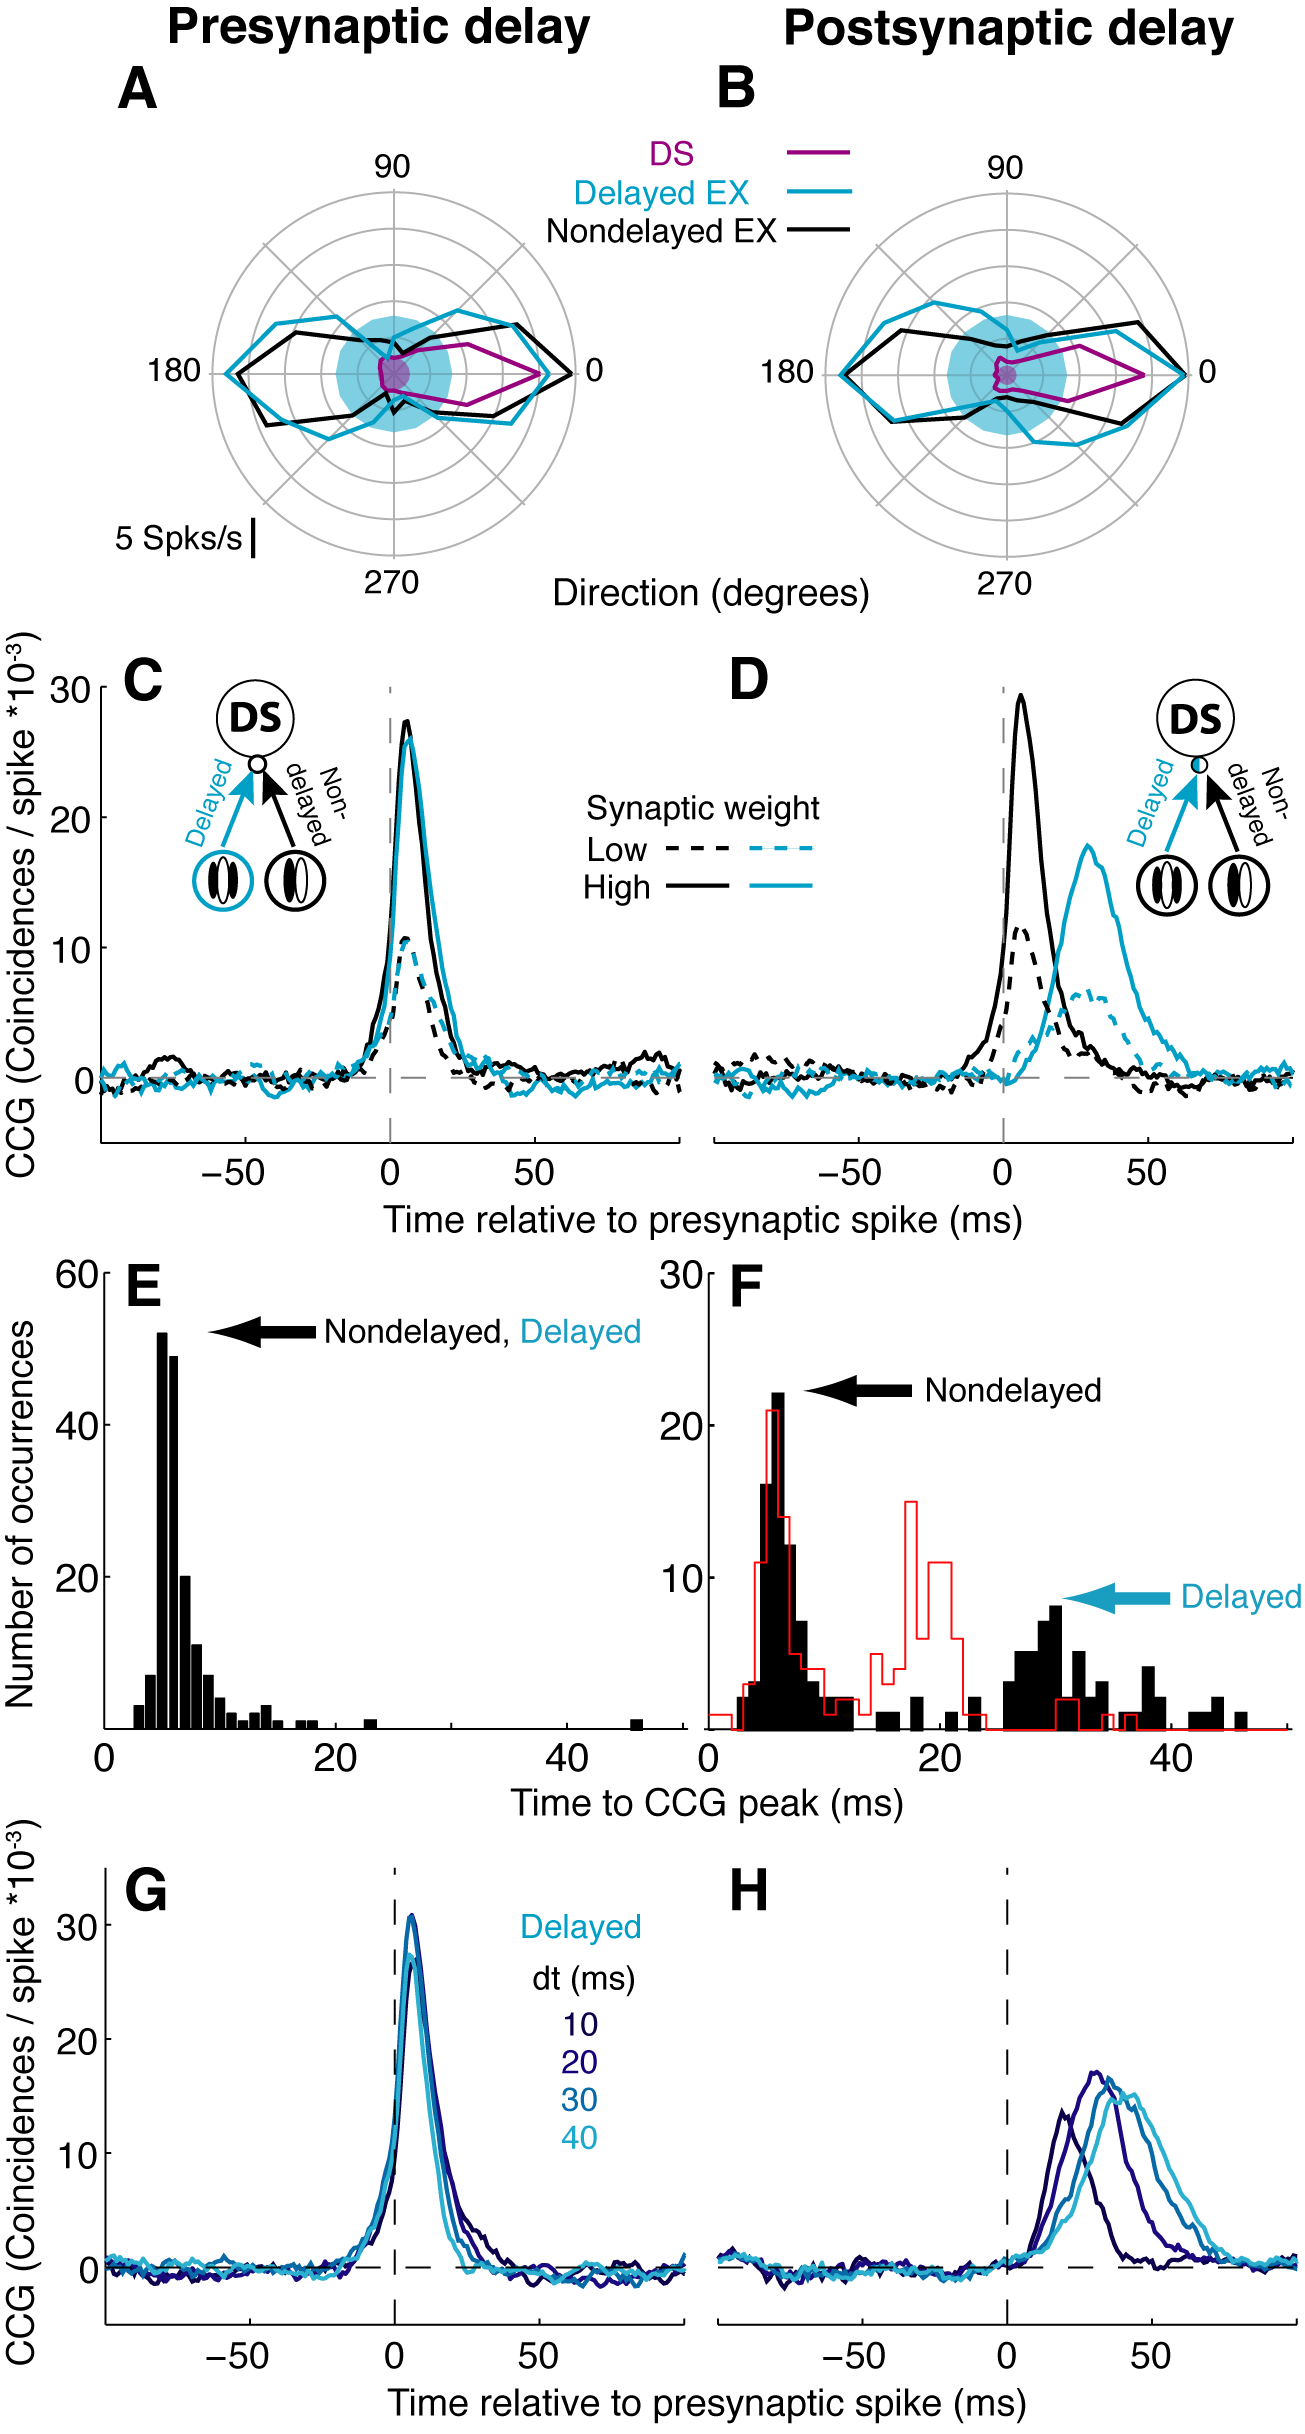
Cross-correlograms can reveal the DS time delay.
Cross-correlograms can reveal the DS time delay.
(A) Direction tuning curves for the Presynaptic Delay model.
(B) Direction tuning curves for the Postsynaptic Delay model.
(C) Cross-correlograms for EX/EX_D-to-DS connections in the Presynaptic Delay model.
(D) Cross-correlograms for EX-to-DS connections in the Postsynaptic Delay model.
(E) Histogram of time-to-CCG peak for all EX and EX_D connections to all DS units in the Presynaptic Delay model.
(F) Histogram of time-to-CCG peak for all EX connections to DS units in the Postsynaptic Delay model.
(G) CCGs for EX-to-DS units for different values of DS time delay, dt, in the Presynaptic Delay model.
(H) CCGs for EX-to-DS units for different values of DS time delay, dt, in the Postsynaptic Delay model.