Figure 3C and E
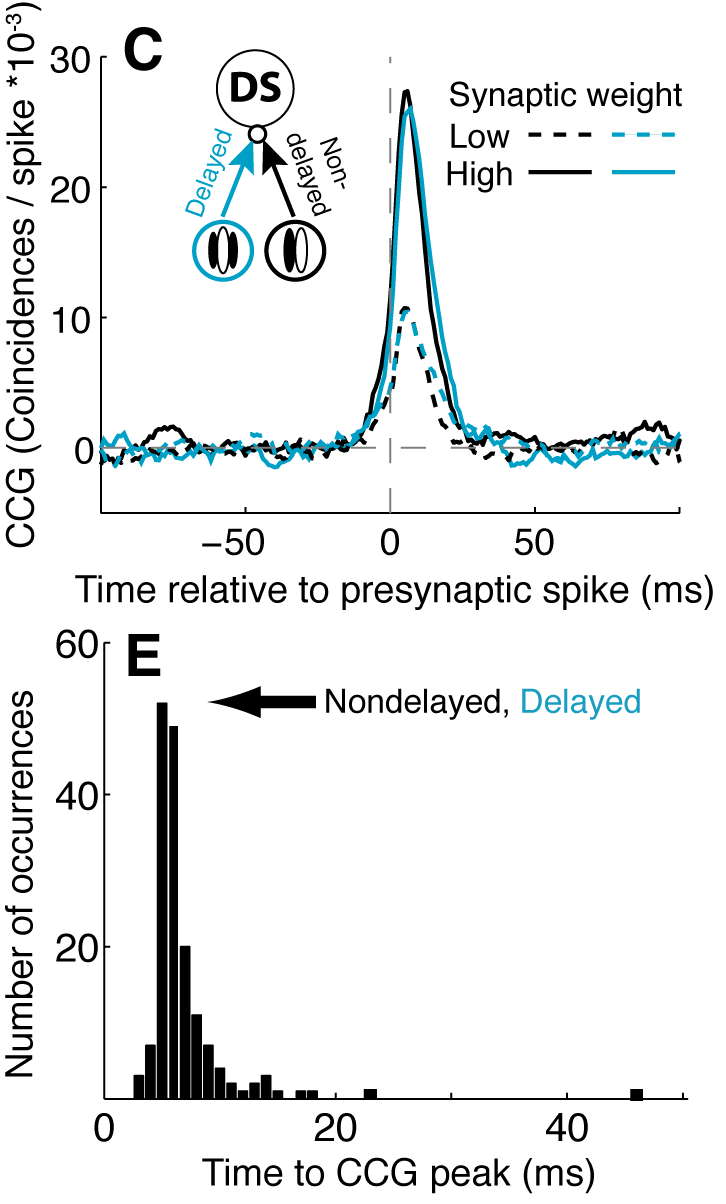
Cross-correlograms and time-to-CCG peak for EX/EX_D-to-DS connections in the Presynaptic Delay model
Cross-correlograms and time-to-CCG peak for EX/EX_D-to-DS connections in the Presynaptic Delay model
In (C), CCGs are plotted for connections EX 6_6_2 and EX_D 6_6_2 to DS 1_1 (solid lines) and EX 5_5_0 and EX_D 5_5_0 to DS 0_1 (dashed lines).
Model
Stimulus
| Preferred direction drifting grating at TF 10 Hz |
Results
Data are presented in separate viewers for each DS unit, including spikes from all input EX and EX_D units, as well as the strongest weighted LGN/LGN_D and IN/IN_D units presynaptic to that DS cell.
| Data for connections presynaptic to: | |||
| DS 0_0 | DS 0_1 | DS 1_0 | DS 1_1 |