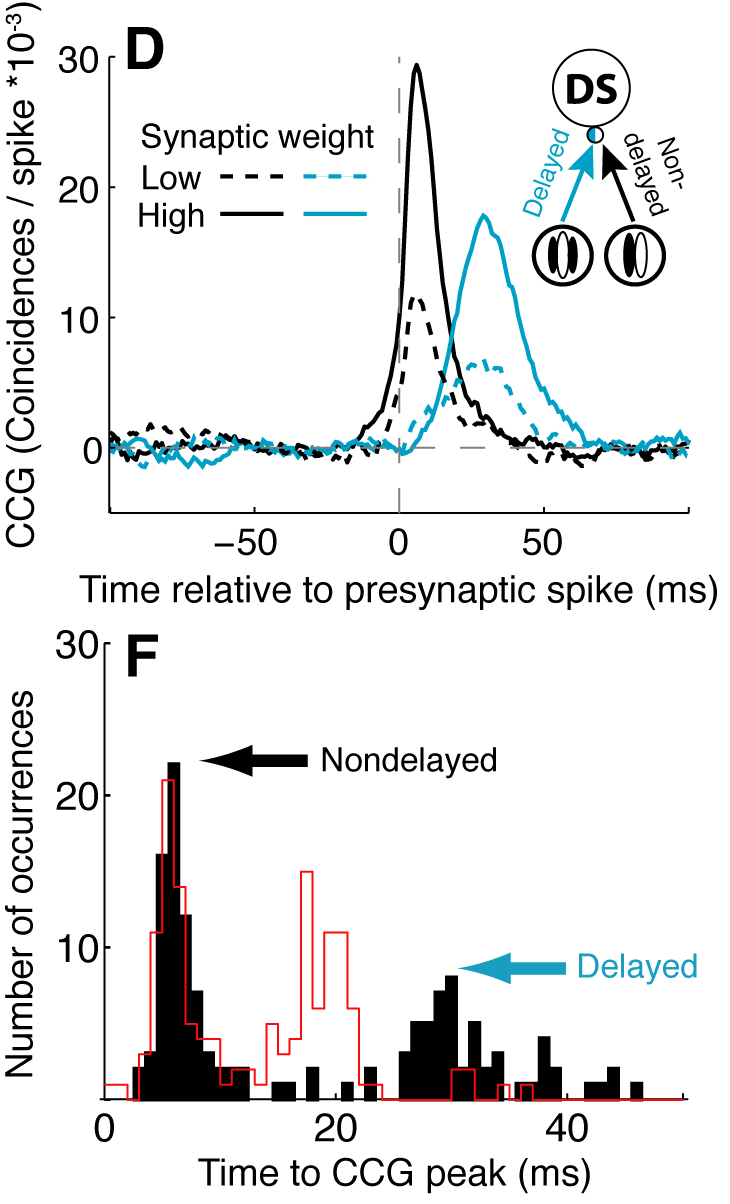
Figure 3D and F
Cross-correlograms and time-to-CCG peak for EX-to-DS connections in the Postsynaptic Delay and hybrid delay models
Cross-correlograms and time-to-CCG peak for EX-to-DS connections in the Postsynaptic Delay and hybrid delay models
In (D), CCGs are plotted for connections EX 6_6_2 and EX 6_6_3 to DS 1_1 (solid lines) and EX 5_5_0 and EX 5_5_1 to DS 0_1 (dashed lines). Red trace in (F) shows data for a hybrid pre- and postsynaptic delay model.
Model
Stimulus
| Preferred direction drifting grating at 10 Hz |
Results
Data are presented in separate viewers for each DS unit, including spikes from all input EX units, as well as the strongest weighted LGN and IN units presynaptic to that DS cell.
| Data for connections presynaptic to: | ||||
| DS_0_0 | DS_0_1 | DS_1_0 | DS_1_1 | |
| DS_Post_Fac | ||||
| DS_PrePost_Fac | ||||