iModel
Related models
DS_Gabor_One
MEO_Gabor
ME_Gabor
MEO_Gabor_Rot
ME_Gabor_Rot
RD_Exp_T
RD_2Gabor
RD_2Gabor_Rect
Variations
Motion energy, V5
Rust NC, Mante V, Simoncelli EP, Movshon JA (2006) How MT cells analyze the
motion of visual patterns. Nature Neurosci 9:1421--1431.
FUNDING: National Science Foundation CRCNS Grant IIS-1309725
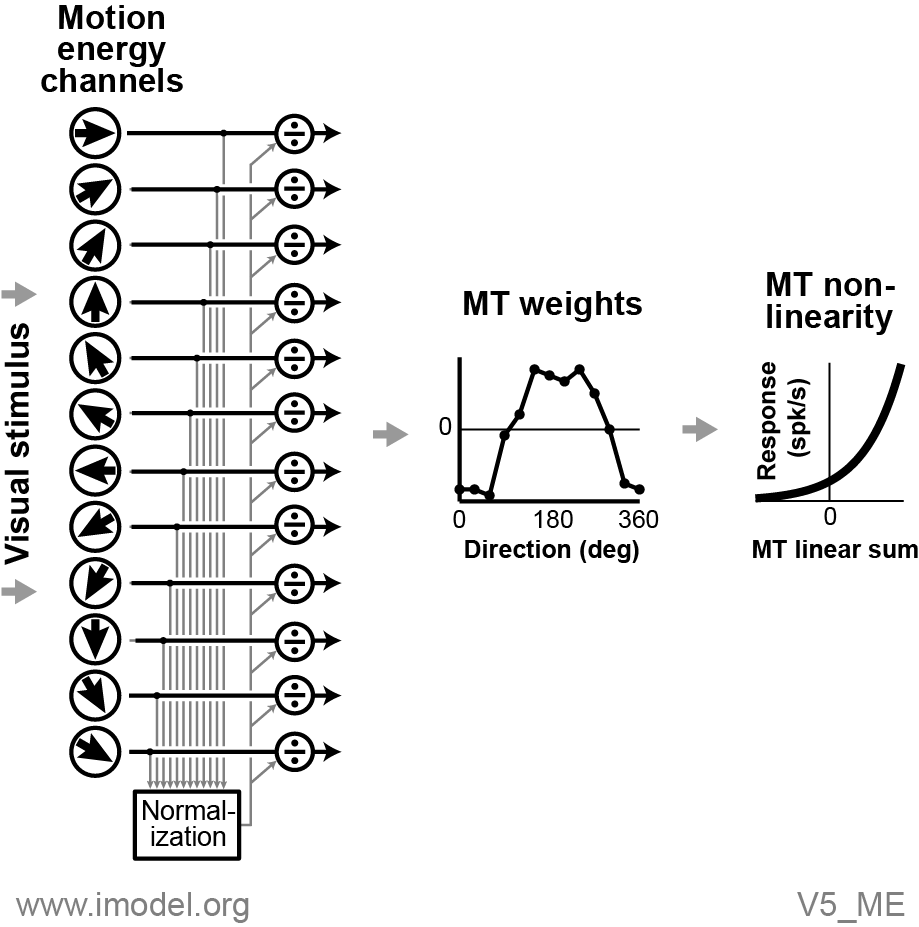
The visual stimulus is processed by a bank of motion energy (ME)
filters (left side), configurable to be either non-opponent or
opponent. The filter outputs are combined to form a normalization
signal that divides the raw ME filter output. The normalized ME
filter outputs are multiplied by a set of constant weights (middle) to
form the MT linear sum. The linear sum is then transformed to a
firing rate by a static, exponential nonlinearity (right). Spikes are
generated via a Poisson process (not shown).