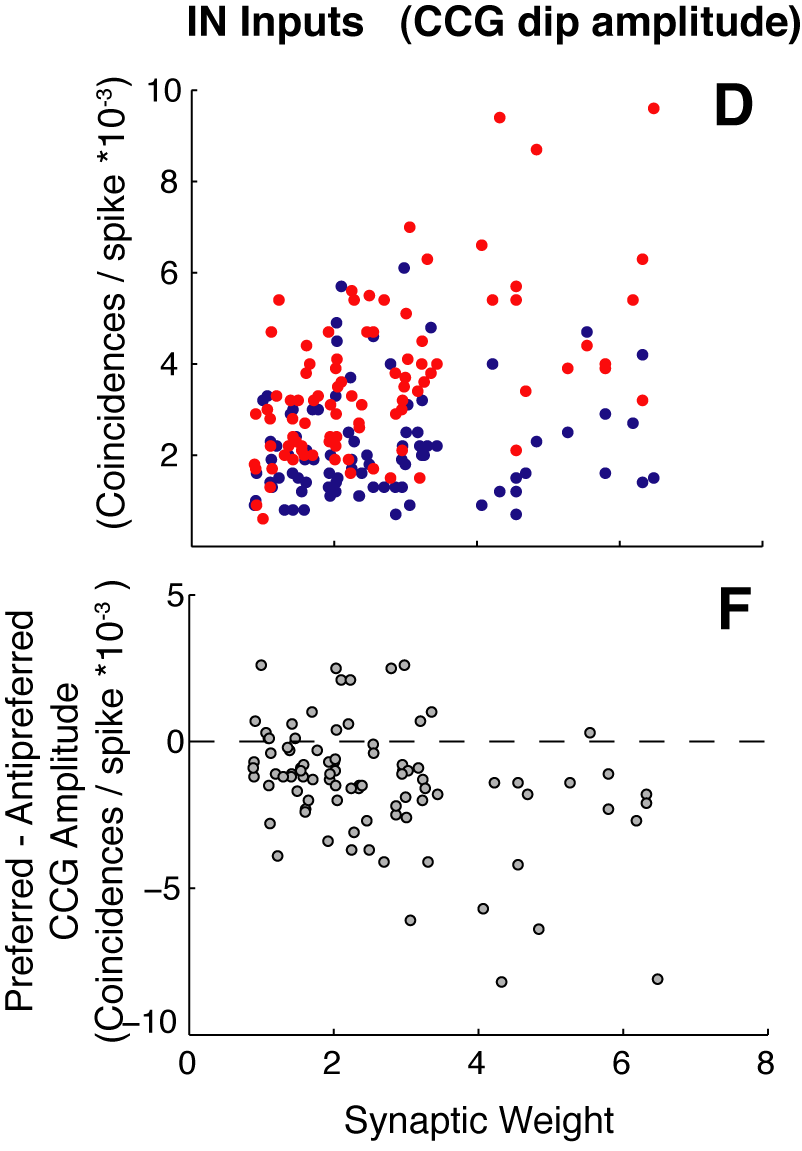
Figure 7D and F
Summary of CCG dip amplitudes for all IN and IN_D-to-DS connections in the Linear model for preferred and antipreferred direction motion.
Summary of CCG dip amplitudes for all IN and IN_D-to-DS connections in the Linear model for preferred and antipreferred direction motion.
In (D), CCG peak amplitudes are plotted for each IN and IN_D input to all DS units in the Linear model for preferred (blue) and antipreferred (red) direction motion. In (F) each point shows the difference in CCG peak amplitude for each connections at the two directions (antipreferred - preferred).
Models
Stimulus
| Drifting gratings at 0 and 180 degrees |
Results
Data are presented in separate viewers for each DS unit, including spikes from all input IN and IN_D units, as well as the strongest weighted LGN and LGN_D units presynaptic to that DS cell.
| Data for connections presynaptic to: | |||
| DS_0_0 | DS_0_1 | DS_1_0 | DS_1_1 |