Figure 5E
CCGs in the suppressive Presynaptic Delay model as stimulus direction and temporal frequency are varied.
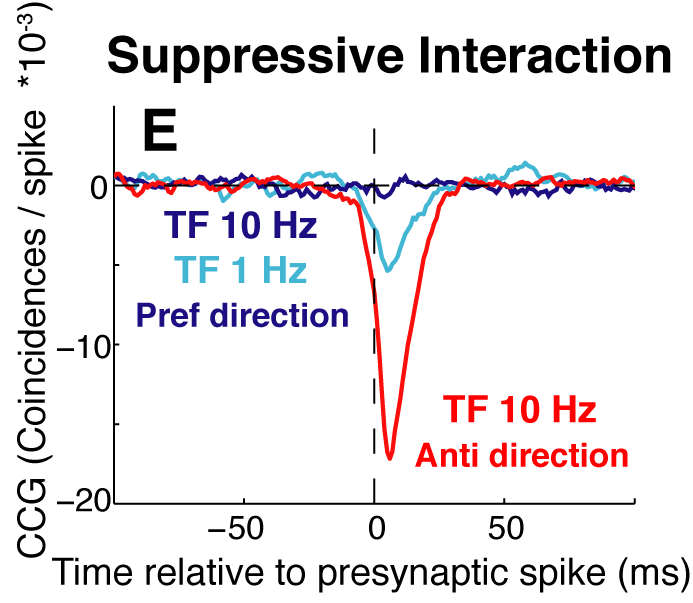
CCGs in the suppressive Presynaptic Delay model as stimulus direction and temporal frequency are varied.
CCGs are plotted for the connection EX_D 6_6_2 to DS 1_1 for drifting gratings at the preferred direction at TF = 1 and 10 Hz (blue traces) and in the antipreferred direction at TF = 10 Hz (red trace).
Model
Stimulus
| Temporal frequency series, preferred and antipreferred directions |
Results
Data are presented in separate viewers for each DS unit, including spikes from all input EX and EX_D units, as well as the strongest weighted LGN/LGN_D and IN/IN_D units presynaptic to that DS cell.
| Data for connections presynaptic to: | |||
| DS 0_0 | DS 0_1 | DS 1_0 | DS 1_1 |