Figure 5A-D
PSTHs as TF and direction are varied for 2 EX units that form a DS subunit in the suppressive Presynaptic Delay model.
PSTHs as TF and direction are varied for 2 EX units that form a DS subunit in the suppressive Presynaptic Delay model.
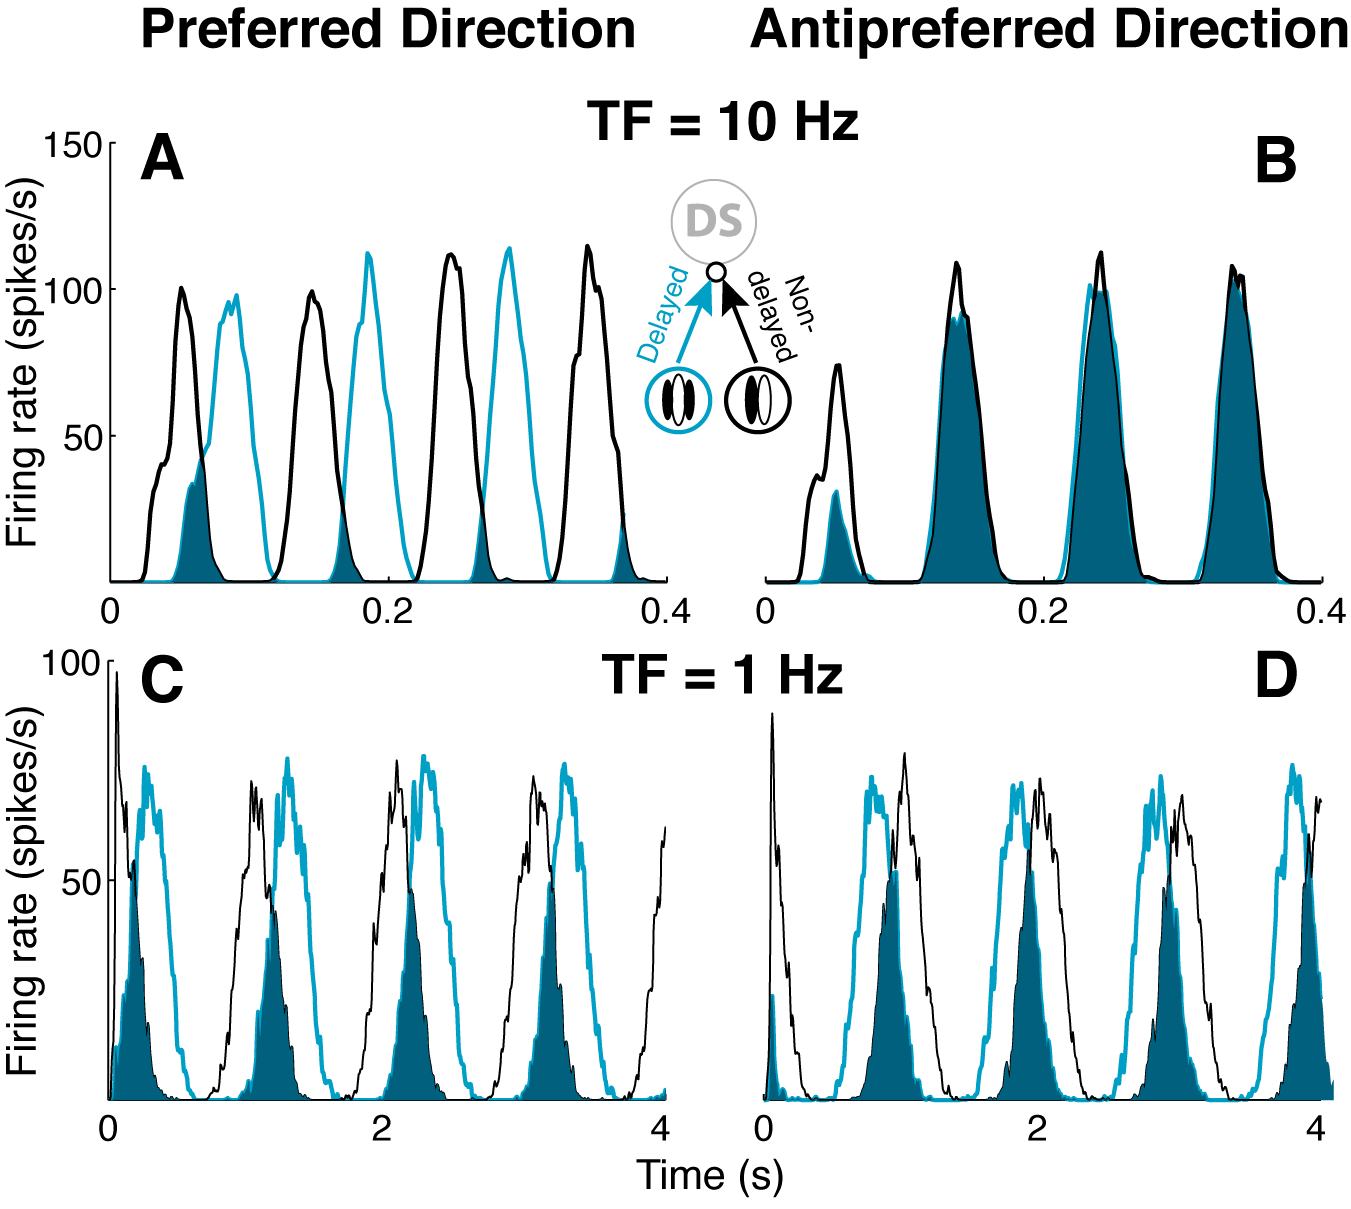
PSTHs are plotted for the units EX 6_6_2 (black traces) and EX_D 6_6_2 (blue traces) in response to drifting gratings at TF = 10 Hz, preferred (A) and antipreferred (B) directions; and TF = 1 Hz, preferred (C) and antipreferred (D) directions. These EX units form a DS subunit providing input to DS 1_1.
Model
Stimulus
| Temporal frequency series, preferred and antipreferred directions |
Results
Data are presented in separate viewers for each DS unit, including spikes from all input EX and EX_D units, as well as the strongest weighted LGN/LGN_D and IN/IN_D units presynaptic to that DS cell.
| Data for connections presynaptic to: | |||
| DS 0_0 | DS 0_1 | DS 1_0 | DS 1_1 |